Comprehensive Guide to Setting Up Alerts in Grafana for Effective Monitoring
Dashboard Config & Alert Setup
Dashboard Setup
When creating alerts the important thing to note is that alerts can only be created for a Time Series panel type.
After an alert is configured to a panel the green heart that's displayed will show the state of the alert. Green=OK, Yellow=Pending & Red=Firing.

Query Definition
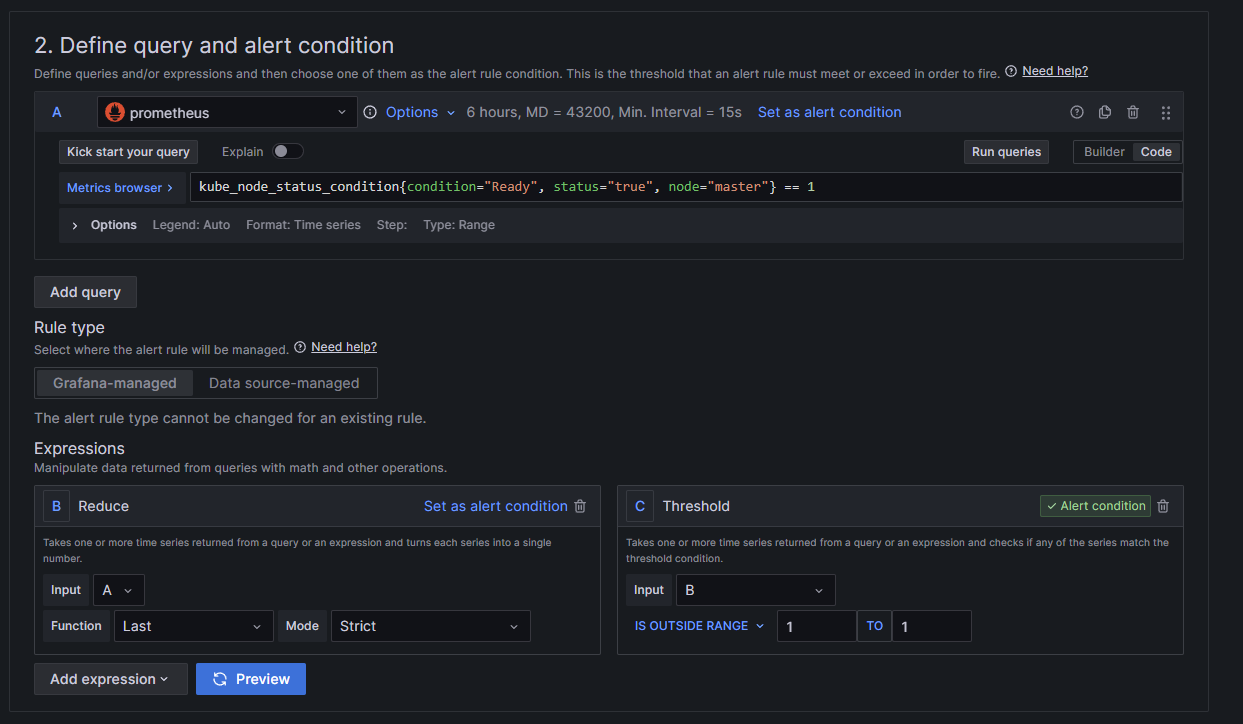
The query shown below gathers the node state in a kubernetes cluster. Rule Type is left as Grafana managed since we use Grafana to send out all our alerts.
Expression is where you define your alert condition. Here we say it to send out an alert if the last value from the query falls outside the range of 1, where 1 is the Ready state.
Evaluation Behavior
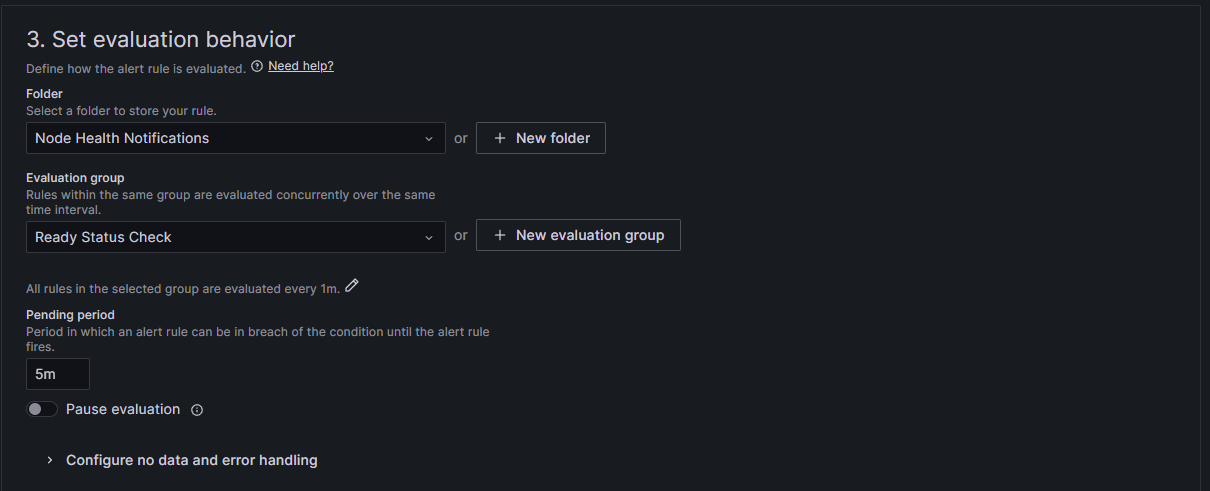
Select or create a new folder which makes sense for you, since the node ready status is related to the cluster nodes, it's going to be grouped with other node metrics.
The Evaluation Group is important since all alerts which are put into that group will be evaluated at the same time. This will ensure that all Ready Status Checks are evaluated every minute at the same minute. You can always change the evaluation interval if you so desire.
The pending period is how long you want to evaluate it for before the alert is triggered. It's good practice to have the pending period be more than you evaluation group interval. This is so that an alert will not be triggered if there was an error receiving the data.
Annotations & Labels
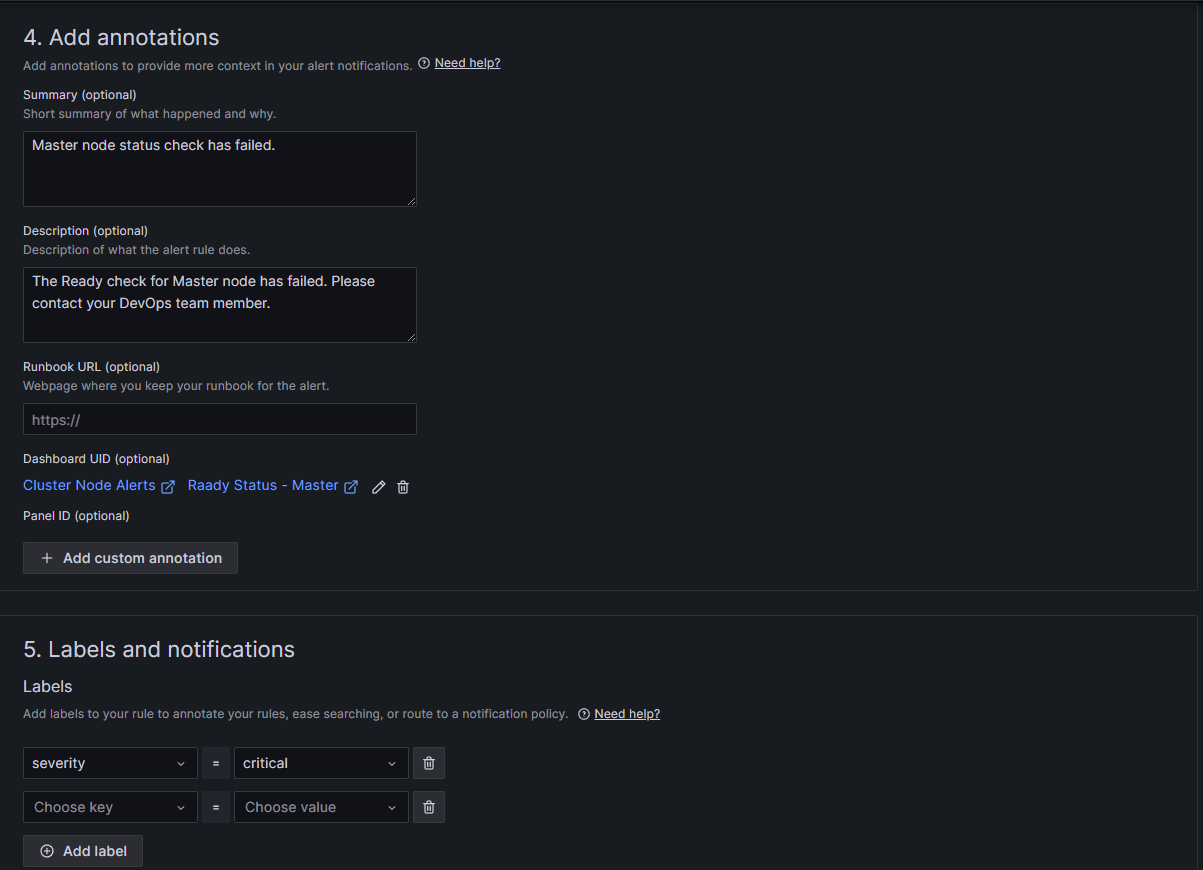
The annotations can be used to mention what the alert is about to the team members that you want to send it out to.
The labels are important as these are needed when you configure your alerting contact points and notification policies. Make sure you have labels that make sense. eg: severity=critical, contact_point=email, team=devops, or environment=staging. These labels can then be used to filter out your alerts when sending them through.
Setting Up Contact Points
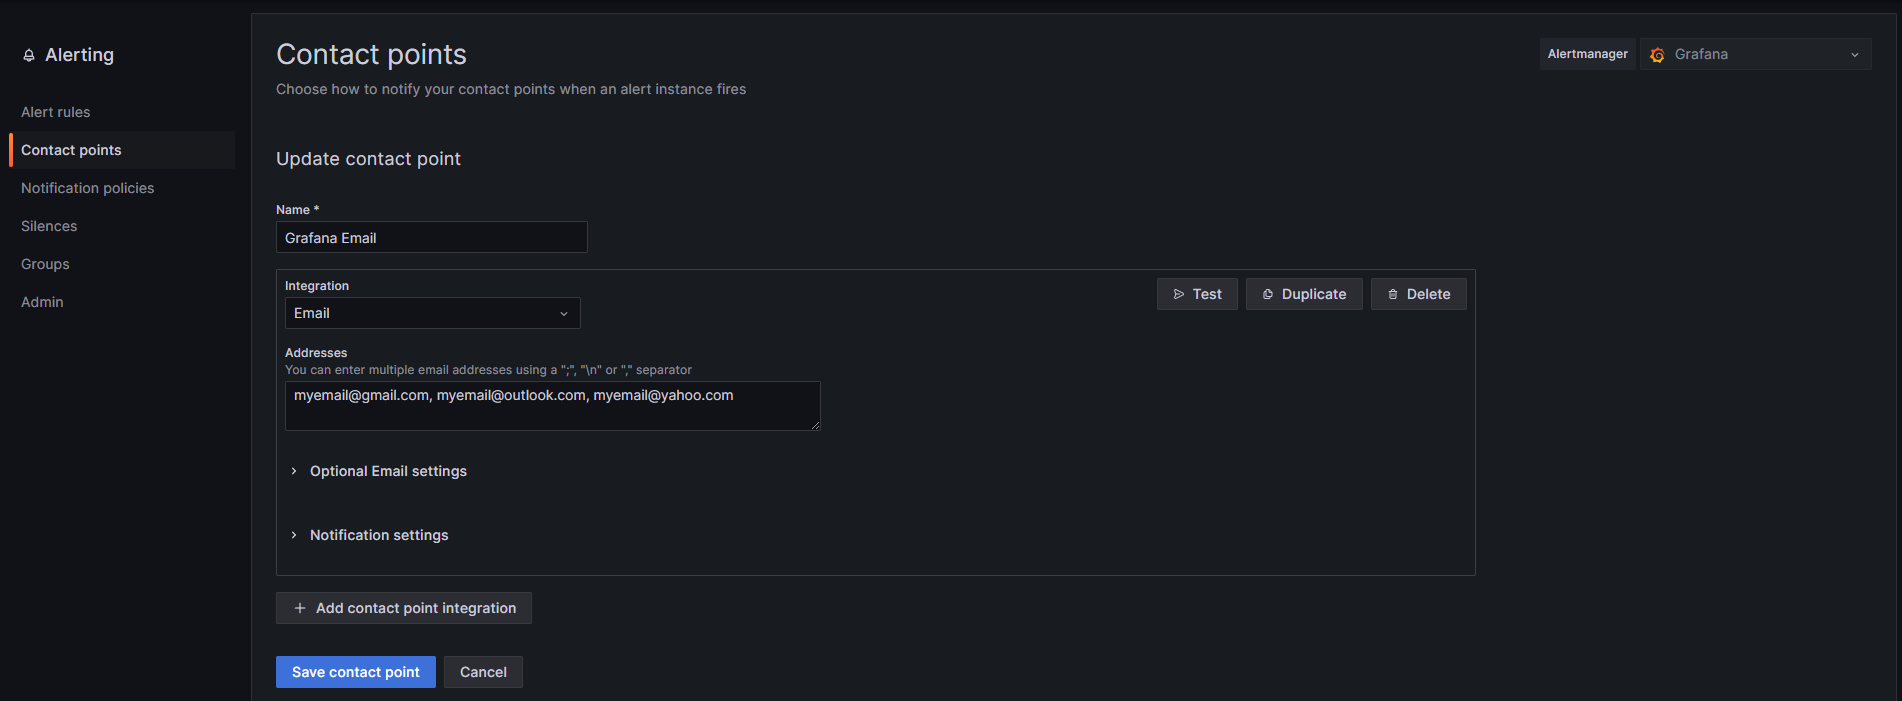
To set up email capabilities in grafana refer to [[Grafana Emails]]. Once, emailing has been configured you can send a test alert from the contact point to ensure that it's functioning as expected as shown below.
MS Teams
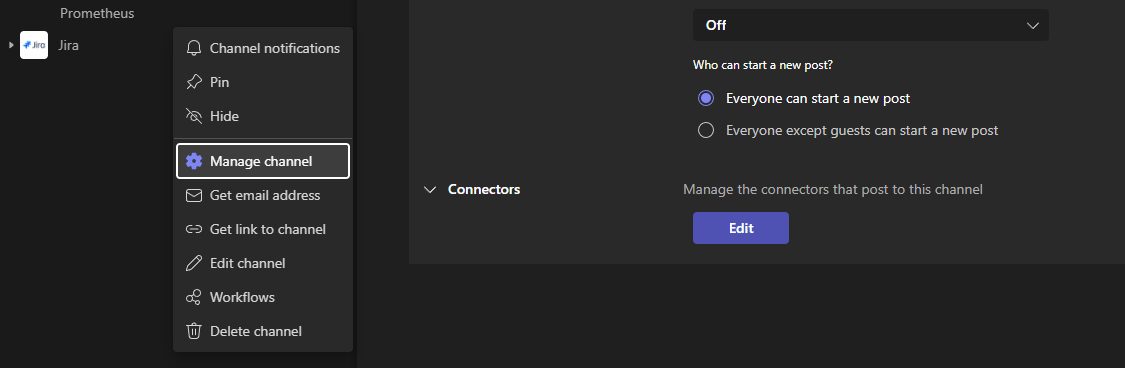
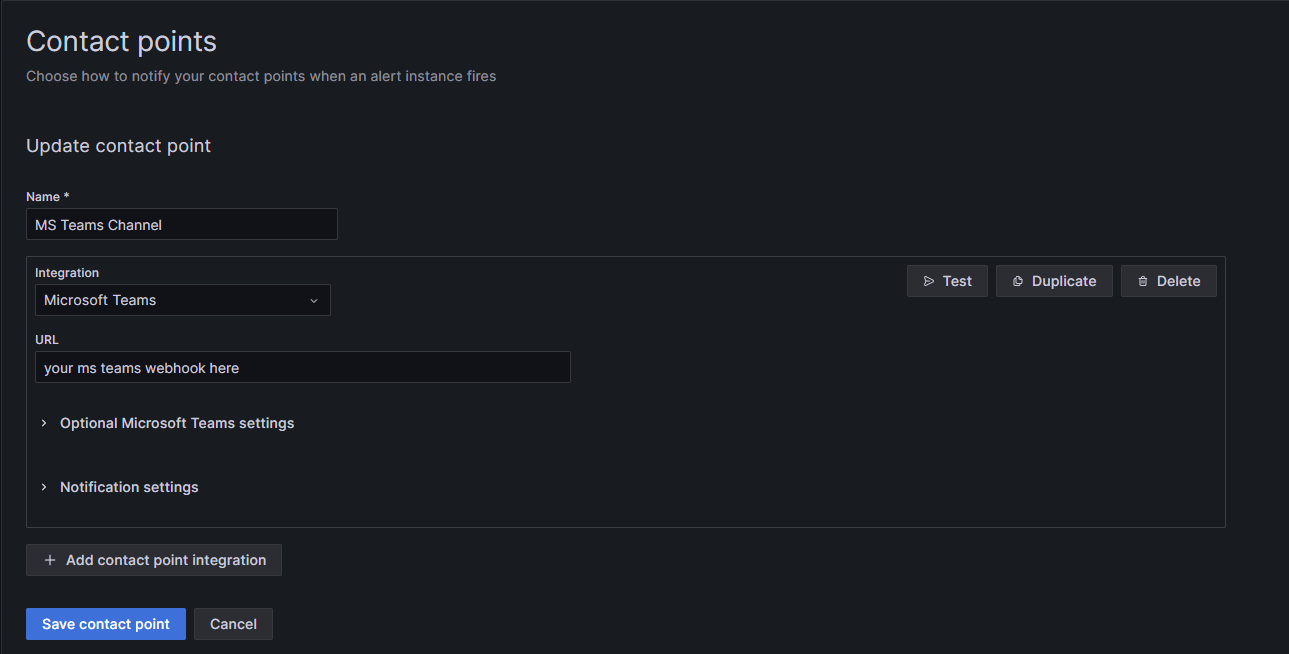
To configure a contact point for Microsoft Teams, you will first need to get a webhook from the teams channel that you want the alerts to go to. This can be done by going into Manage Channel and clicking on the Edit button under Connectors. Then search for Incoming Webhooks and follow the steps and copy the webhook URL.
Once you have copied the webhook, you can proceed with the grafana setup shown below.
Notification Policies
The last thing you have to configure in order to make sure your alerts are going to functioning as expected are the notification policies.
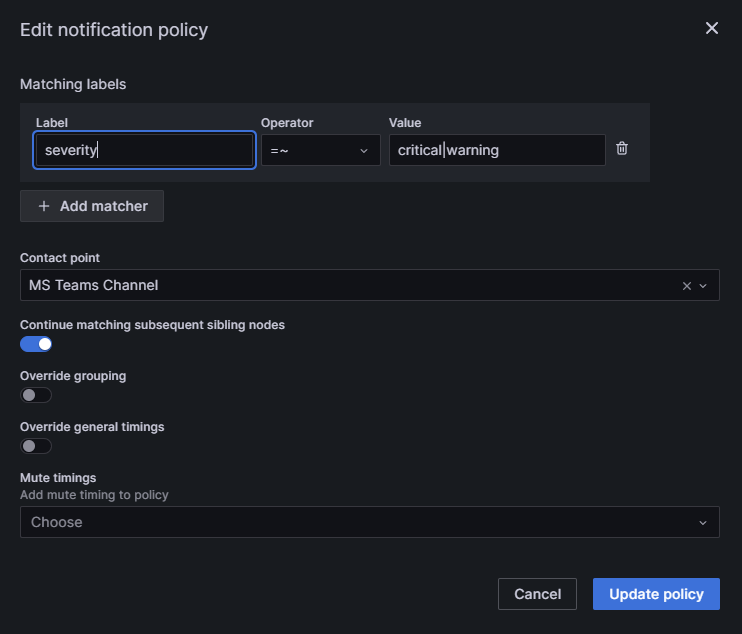
It's important to note that when creating nested policies, the first policy which matches the alert label will be triggered and the alert will not go further down the policy tree. If you want the alert labels to continue matching down the policy tree you will have to check the Continue matching subsequent sibling nodes toggle on. This will ensure that the alert labels continue to match the policies down the notification policy tree. This would be a required toggle if you wish to send your alerts to multiple contact points at the same time.
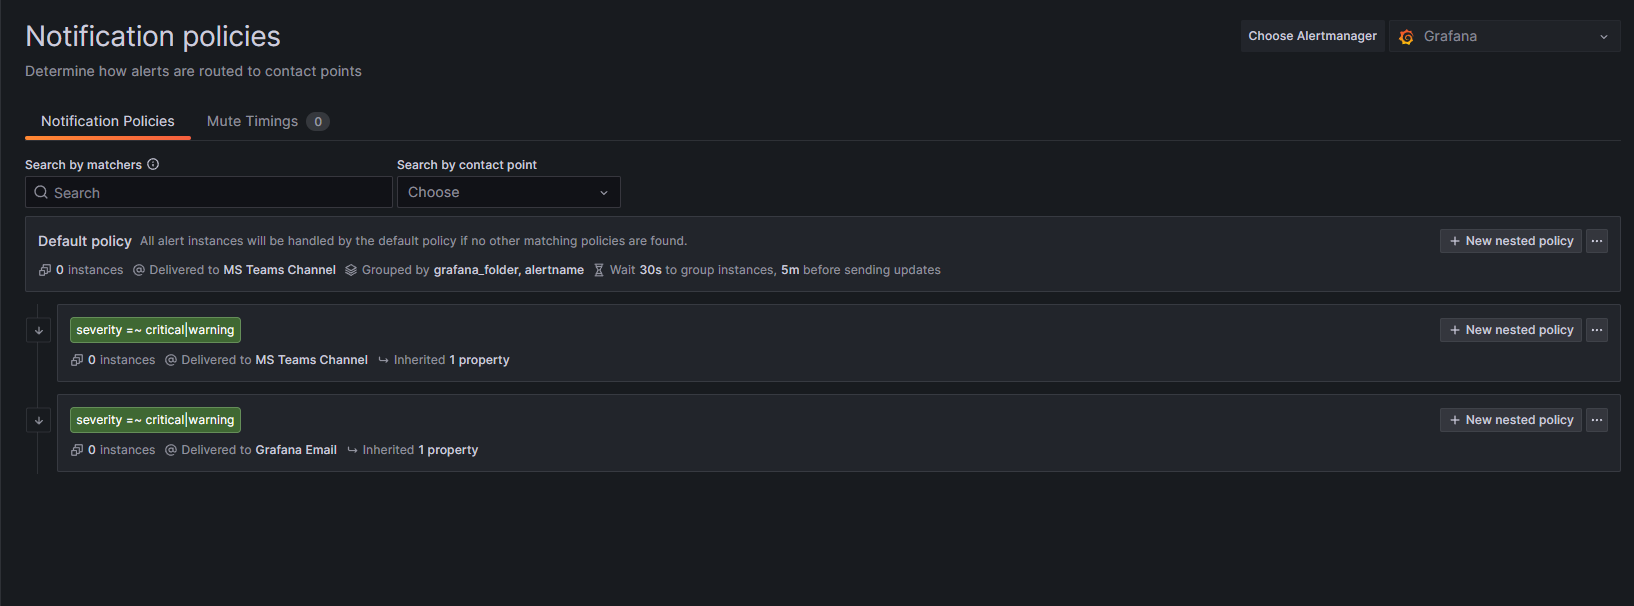
Things to keep in mind when configuring the policies:
Default Policy: This is the policy that's matched when an alert DOES NOT match any of the labels you have configured in your alerts.
Nested Policy: These are what you will be creating. Here you define what matching labels you want to send to a contact point of your choosing. The image below uses a regex expression to match severity level warning or critical labels from the firing alert and then send it over the MS Teams contact point which was configured earlier.